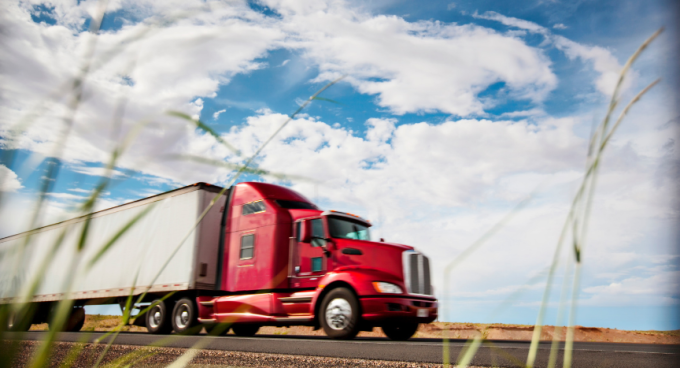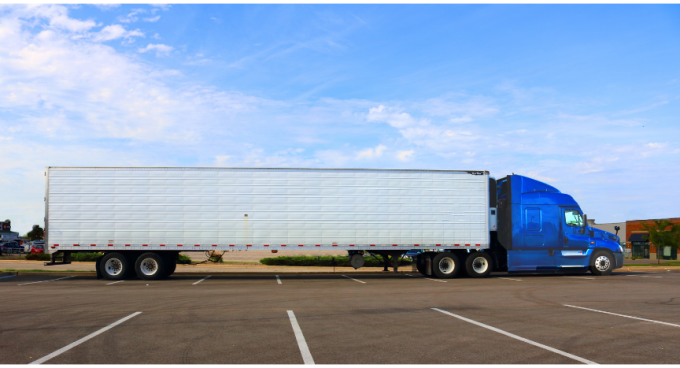


A trucking job in Tacoma can look quite different from one based in Spokane or Yakima. Around Puget Sound, freight moves between busy marine terminals, warehouses and distribution centers. Farther east, agricultural shipments, food processing and regional freight networks shape much of the transportation work. Those differences extend to the schedules carriers offer, the way they calculate pay and what a driver can earn over a year.
Washington’s wages are above the national midpoint, but the statewide figure only tells part of the story. The latest federal data shows a noticeable gap between the Seattle-Tacoma area and several smaller markets, along with some surprisingly close comparisons between eastern and western Washington.
Washington Truck Driver Salaries
The Bureau of Labor Statistics (BLS) reported a median annual wage of $64,760 for Washington’s heavy and tractor-trailer truck drivers in May 2025. That works out to $31.13 per hour, compared with a national median of $58,640.
Washington’s median was about $6,120 higher than the national figure, although that difference doesn’t account for housing costs or other expenses that vary across the country.
A look at the full wage range gives a better sense of what employees in the occupation were earning.
| Wage level | Annual pay |
| Lowest 10% | $50,010 or less |
| 25th percentile | $59,450 |
| Median | $64,760 |
| 75th percentile | $75,530 |
| Highest 10% | $87,500 or more |
The gap between the 25th and 75th percentiles was more than $16,000. That’s a substantial difference for people working within the same occupation, and it helps explain why two trucking jobs in Washington may come with very different annual pay.
The figures cover employees rather than self-employed owner-operators. They also combine many kinds of trucking work, so they shouldn’t be mistaken for a specific carrier’s salary range.
Seattle and Tacoma Have the Highest Median Pay
The Seattle-Tacoma-Bellevue metropolitan area led Washington’s major markets with a median annual wage of $71,240. Its upper-end wages were also notable, reaching $93,810 at the 90th percentile.
There’s a considerable amount of trucking activity concentrated in this part of the state. The BLS counted approximately 21,230 heavy and tractor-trailer truck driving jobs in the metropolitan area, more than half of the 40,530 jobs estimated statewide.
Seattle and Tacoma are part of one of the country’s important port regions. The Northwest Seaport Alliance oversees marine cargo operations at both ports, while nearby warehouses, manufacturing facilities and distribution centers support freight movement throughout the region.
That activity helps explain the variety of trucking work available around Puget Sound, but it would be misleading to attribute the area’s higher median directly to port operations. The BLS data includes employees across industries and doesn’t separate container hauling from other assignments.
It’s also worth noting that Seattle and Tacoma are combined in the federal wage estimates. Someone comparing jobs in the two cities will need to look at individual offers rather than treating $71,240 as a separate median for each location.
Truck Driver Pay in Spokane and Eastern Washington
Spokane’s median annual wage was $62,980, putting it less than $2,000 below Washington’s statewide figure. The city sits at the intersection of several important freight routes, including Interstate 90, which connects eastern Washington with markets to the west and east.
Kennewick-Richland reported a similar median of $62,520. Transportation in the Tri-Cities region serves agricultural production, food processing, manufacturing and distribution, giving drivers access to work that differs from the port-centered activity around Puget Sound.
Walla Walla came in at $60,300, while Yakima reported $57,210 and Wenatchee-East Wenatchee reached $58,070. Those lower medians are worth considering, particularly for drivers weighing local opportunities against regional jobs based elsewhere.
The differences don’t establish which freight pays best in each market. They show what employees across the occupation earned, without identifying individual carriers, routes or compensation arrangements.
Truck Driver Wages Across Washington Cities
For a broader comparison, the latest BLS figures show how median annual wages differed among Washington’s metropolitan areas.
| Metropolitan area | Median annual pay |
| Seattle-Tacoma-Bellevue | $71,240 |
| Portland-Vancouver-Hillsboro, OR-WA | $63,800 |
| Olympia-Lacey-Tumwater | $63,040 |
| Spokane-Spokane Valley | $62,980 |
| Longview-Kelso | $62,930 |
| Bremerton-Silverdale-Port Orchard | $62,710 |
| Kennewick-Richland | $62,520 |
| Bellingham | $61,890 |
| Walla Walla | $60,300 |
| Wenatchee-East Wenatchee | $58,070 |
| Yakima | $57,210 |
Several markets were separated by relatively small amounts. Olympia, Spokane, Longview and Bremerton all reported medians between approximately $62,700 and $63,100, despite serving different industries and parts of the state.
Vancouver requires a little additional context. Its $63,800 figure comes from the Portland-Vancouver-Hillsboro metropolitan area, which includes communities in Oregon. It isn’t a Washington-only wage estimate.
These comparisons are useful when considering where to work, but they don’t establish what a particular carrier is currently offering. Published wages reflect a broad group of employees, including people with different schedules and pay arrangements.
Trucking Wages Outside Major Cities
Smaller communities also account for a significant part of Washington’s freight activity. Agricultural products, timber, manufactured goods and everyday deliveries all need transportation beyond the state’s metropolitan centers.
The BLS reported a median annual wage of $61,200 in eastern nonmetropolitan Washington. Western nonmetropolitan Washington was somewhat higher at $62,540.
Neither figure was dramatically below the medians reported in several metropolitan markets. In fact, western nonmetropolitan Washington was almost identical to Kennewick-Richland, while eastern nonmetropolitan Washington exceeded the medians in Yakima and Wenatchee.
That makes the rural figures particularly useful for drivers who prefer to remain based in smaller communities. The estimates don’t identify specific counties or employers, but they show that a position outside a major city doesn’t necessarily fall far below the state’s typical earnings.
What a Pay Rate Doesn’t Tell You
A carrier advertising 65 cents per mile and another offering an hourly position aren’t presenting numbers that can be compared directly. The annual income from either job depends on how much paid work is actually available.
For mileage-based positions, weekly miles make an obvious difference. So do compensation for stops, delays and other activities that may take time without adding mileage. A guaranteed minimum can also change the calculation when freight slows down.
Hourly work comes with its own considerations, including the expected schedule and whether additional hours qualify for overtime. Some trucking positions are subject to different overtime rules, making it important to understand how an employer handles pay before accepting an offer.
Benefits can further change the comparison. Employer contributions toward health coverage or retirement, along with paid time off and other compensation, may add value that isn’t apparent from the advertised base rate.
A driver considering a higher-paying job in the Seattle area should also weigh the cost of living against an offer closer to home. The difference between regional medians may look attractive on paper without necessarily translating into a better financial outcome.
Putting Washington’s Wage Figures to Use
The most useful way to approach Washington’s salary data is to compare similar jobs within the same market before looking at opportunities elsewhere. A local hourly position in Spokane and a long-haul mileage-based job out of Tacoma may both fall under the BLS occupation, but the working arrangements can be very different.
When discussing an offer, ask the carrier to explain how its advertised pay translates into expected weekly and annual earnings. The answer should account for the normal workload, additional paid duties and any guarantees rather than relying solely on the highest possible rate.
Washington’s statewide median of $64,760 gives drivers a reference point, while the regional figures help narrow the comparison. Together, they offer a more useful picture of compensation than a single statewide salary estimate.
Frequently Asked Questions
Does Washington’s wage data include owner-operators?
No. The BLS Occupational Employment and Wage Statistics program excludes self-employed workers. Owner-operators need to account for operating expenses when calculating income, since business revenue isn’t the same as personal earnings.
Are the reported salaries before or after taxes?
The wage figures represent gross earnings before employee taxes and deductions. Actual take-home pay depends on individual circumstances, including withholding and benefit contributions.
Do truck drivers in Washington receive overtime pay?
Overtime eligibility depends on the work performed and the applicable employment laws. Some transportation employees fall under exemptions, so drivers should confirm how overtime is handled for a particular position rather than assuming every job follows the same rules.
Can drivers use these wage figures to negotiate pay?
The BLS estimates can provide an independent reference when discussing compensation, especially when comparing similar positions in the same region. However, they don’t establish what a carrier is required to pay or account for every feature of an individual job.
When will newer Washington salary figures be available?
The BLS publishes occupational wage estimates annually. The May 2025 figures used in this guide were the latest available as of October 2026. More recent job advertisements may reflect changes that haven’t yet appeared in the federal data.
The Truck Drivers USA editorial team provides news, industry updates and original content focused on professional truck drivers across the United States. Our coverage helps readers stay informed about regulations, transportation developments and issues affecting the trucking industry.
Last Updated: October 13, 2026