

Truck drivers running freight through major metropolitan areas this summer may want to keep an eye on World Cup schedules.
The tournament got underway on June 11 and will continue through July 19, bringing matches to 16 cities across the United States, Canada, and Mexico. While sporting events regularly generate traffic around stadiums, transportation analysts believe some host cities could experience broader congestion issues that extend beyond game-day traffic.
A recent study from telematics company Geotab suggests the biggest concern may not be how busy a city normally is, but how well it handles sudden spikes in activity.
Not Every Host City Responds the Same Way to Large Events
Ahead of the tournament, Geotab reviewed billions of vehicle data points collected during June and July 2025. The analysis examined how host-city transportation networks performed during periods that included major concerts, sporting events, and other large public gatherings.
Rather than looking only at traffic volume, the company evaluated how quickly road networks recovered after demand increased. That measurement, referred to as resilience, became one of the most important indicators in the study.
A city with heavy daily congestion may still perform relatively well during a major event if traffic conditions return to normal quickly. A city with weaker resilience can experience lingering transportation disruptions long after crowds arrive.
Several Cities Ranked Near the Bottom of the Study
Ten of the sixteen host cities received preparedness scores below 7 out of 10. Foxborough, Massachusetts, which will host matches in the Boston area, earned the highest overall score at 8.01.
Los Angeles, Vancouver, and Toronto landed at the bottom of the rankings, each scoring below 5.
The report also highlighted Los Angeles and Atlanta for particularly poor resilience scores based on how transportation networks responded to large events during the summer of 2025. According to Geotab’s findings, both cities struggled to absorb increased demand without significant traffic disruptions.
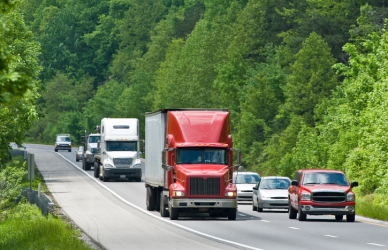
For freight carriers and owner-operators, those markets could become more challenging as tournament attendance increases throughout the coming weeks.
Why The Findings Matter for Truck Drivers
Traffic delays around a stadium are rarely the biggest concern for commercial vehicles. The larger issue is how event-related traffic affects surrounding highways, local routes, delivery schedules, and freight movement throughout an entire metropolitan area.
Geotab weighted traffic conditions around stadium locations heavily in its rankings but also included data from the broader metro regions surrounding each venue.
That wider approach provides a better picture of how transportation networks may perform once hundreds of thousands of visitors begin moving through host cities.
Extra Planning Could Help Avoid Delays
Mike Branch, Geotab’s vice president of data and analytics, said resilience scores may provide a useful indicator of how cities will perform during the tournament.
According to Branch, cities with stronger resilience ratings are generally better equipped to handle temporary surges in activity. Areas with lower resilience scores may require additional planning as transportation demand increases.
For truck drivers, that could mean building extra time into schedules, monitoring traffic conditions more closely, and evaluating alternate routes when operating near host markets on match days.
Tournament Continues Through July 19
Matches are scheduled almost daily through July 19, when the championship match will be played in the New York City metropolitan area.
With events taking place throughout North America for more than a month, freight traffic moving through host markets could encounter periodic slowdowns as cities manage increased visitor activity alongside normal transportation demands.
The Truck Drivers USA editorial team creates practical, driver-focused content covering industry topics, job trends, and real-world decisions that impact drivers at every stage of their careers. Each article is written to provide clear, accurate information that drivers can use.
Last updated: June 12, 2026
Source: Overdrive